Description
UPC325AE01 3BHB000644R0001 Модуль ввода / вывода ABB
CC – Link и другие. Каждый слот IO может быть выбран автономно в соответствии с потребностями клиента, а один модуль поддерживает до 16 каналов.
Технологии основаны на инновацияхUPC325AE01 3BHB000644R0001 Предоставление клиентам высококачественных и надежных продуктов всегда было постоянным стремлением к нулю.
Давайте посмотрим на его инновации и различия с предшественниками: с жидкокристаллическим дисплеем, вы можете увидеть параметры связи, состояние канала IO,
информацию о версии модуля и так далее; UPC325AE01 3BHB000644R0001 Отладка и обслуживание более интуитивно понятны; ABS огнестойкая пластиковая оболочка, небольшой размер,
легкий вес, с использованием совершенно новой пряжки монтажной карты, установка более прочная и надежная.
3.2 Machine learning
As the functionality of distributed computing tools such as Spark MLLib (http://spark.apache.org/mllib) and SparkR (http://spark.apache
.org/docs/latest/index.html) increases, it becomes It is easier to implement distributed and online machine learning models, such as support
vector machines, gradient boosting trees and decision trees for large amounts of data. Test the impact of different machine parameters and process
measurements on overall product quality, from correlation analysis to analysis of variance and chi-square hypothesis testing to help determine the impact of individual
measurements on product quality. This design trains some classification and regression
models that can distinguish parts that pass quality control from parts that do not. The trained models can be used to infer decision rules. According to the highest purity rule,
purity is defined as Nb/N, where N is the number of products that satisfy the rule and Nb is the total number of defective or bad parts that satisfy the rule.
Although these models can identify linear and nonlinear relationships between variables, they do not represent causal relationships. Causality is critical to
determining the true root cause, using Bayesian causal models to infer causality across all data.
3.3 Visualization
A visualization platform for collecting big data is crucial. The main challenge faced by engineers is not having a clear and comprehensive overview of the complete manufacturing
process. Such an overview will help them make decisions and assess their status before any adverse events occur. Descriptive analytics uses tools such as
Tableau (www.tableau.com) and Microsoft BI (https://powerbi.microsoft.com/en-us) to help achieve this. Descriptive analysis includes many views such as
histograms, bivariate plots, and correlation plots. In addition to visual statistical descriptions,
a clear visual interface should be provided for all predictive models. All measurements affecting specific quality parameters can be visualized and the data
on the backend can be filtered by time.
ABB UNS0119A-P,V101 3BHE029153R0101
UNS0119A-P,V101 3BHE029154P3 REV.G
UNS0119A-P,V101 3BHE029154P3 REV.G 3BHE029153R0101
ABB UNS0119A-P,V101
ABB 3BHE042393R0101
ABB UNS0122A-P 3BHE042393R0101
ABB UNS0122A-P
ABB HIER471062P1
ABB UNS0874A HIER471062P1
ABB UNS0874A
GE DS3800DFXA1B1C
GE DS3800HPIB
GE DS6800CCIE1F1D
ABB 3BHB006338R0001
ABB UNS0881a-P,V1
ABB UNS0881a-P,V1 3BHB006338R0001
ABB 3BHE008128R0001
ABB UNS0887A-P
ABB UNS0887A-P 3BHE008128R0001
ABB 3BHE014967R0002
ABB UNS2880b-P,V2
ABB UNS2880b-P,V2 3BHE014967R0002
ABB 3BHE009319R0001
ABB UNS2881b-P,V1
ABB UNS2881b-P,V1 3BHE009319R0001
ABB 3BHE003855R0001
ABB UNS2882A
ABB UNS2882A 3BHE003855R0001
ABB HIEE205019R4
ABB UNS2980c-ZV4
ABB UNS2980c-ZV4 HIEE205019R4
ABB HIEE205011R0002
ABB UNS3670A-Z V2
ABB UNS3670A-Z V2 HIEE205011R0002
ABB 3BHE009949R0004
ABB UNS4881b,V4
ABB UNS4881b,V4 3BHE009949R0004
ABB 3BSE042240R1
ABB PP825
ABB PP825 3BSE042240R1
ABB 3BSE042240R3
ABB PP825A
ABB PP825A 3BSE042240R3
ABB 3BSE042237R1
ABB PP836
ABB PP836 3BSE042237R1
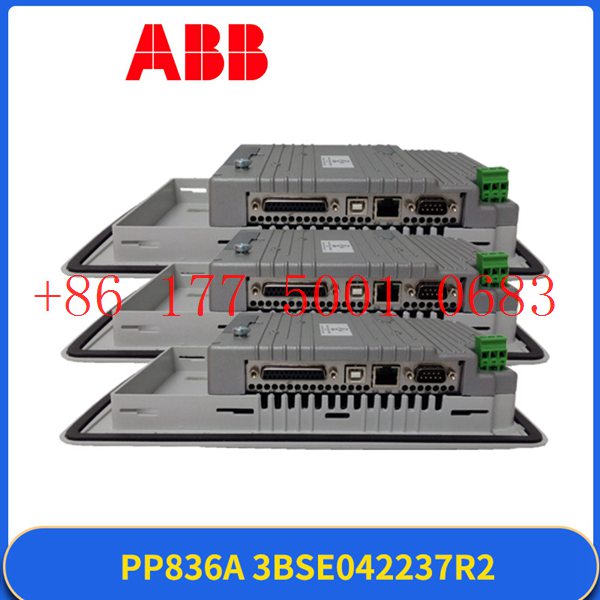
ABB 3BSE042237R2
ABB PP836A
ABB PP836A 3BSE042237R2
ABB 3BSE042235R1
ABB PP845


Reviews
There are no reviews yet.